Context and problem
Interpreting the source data
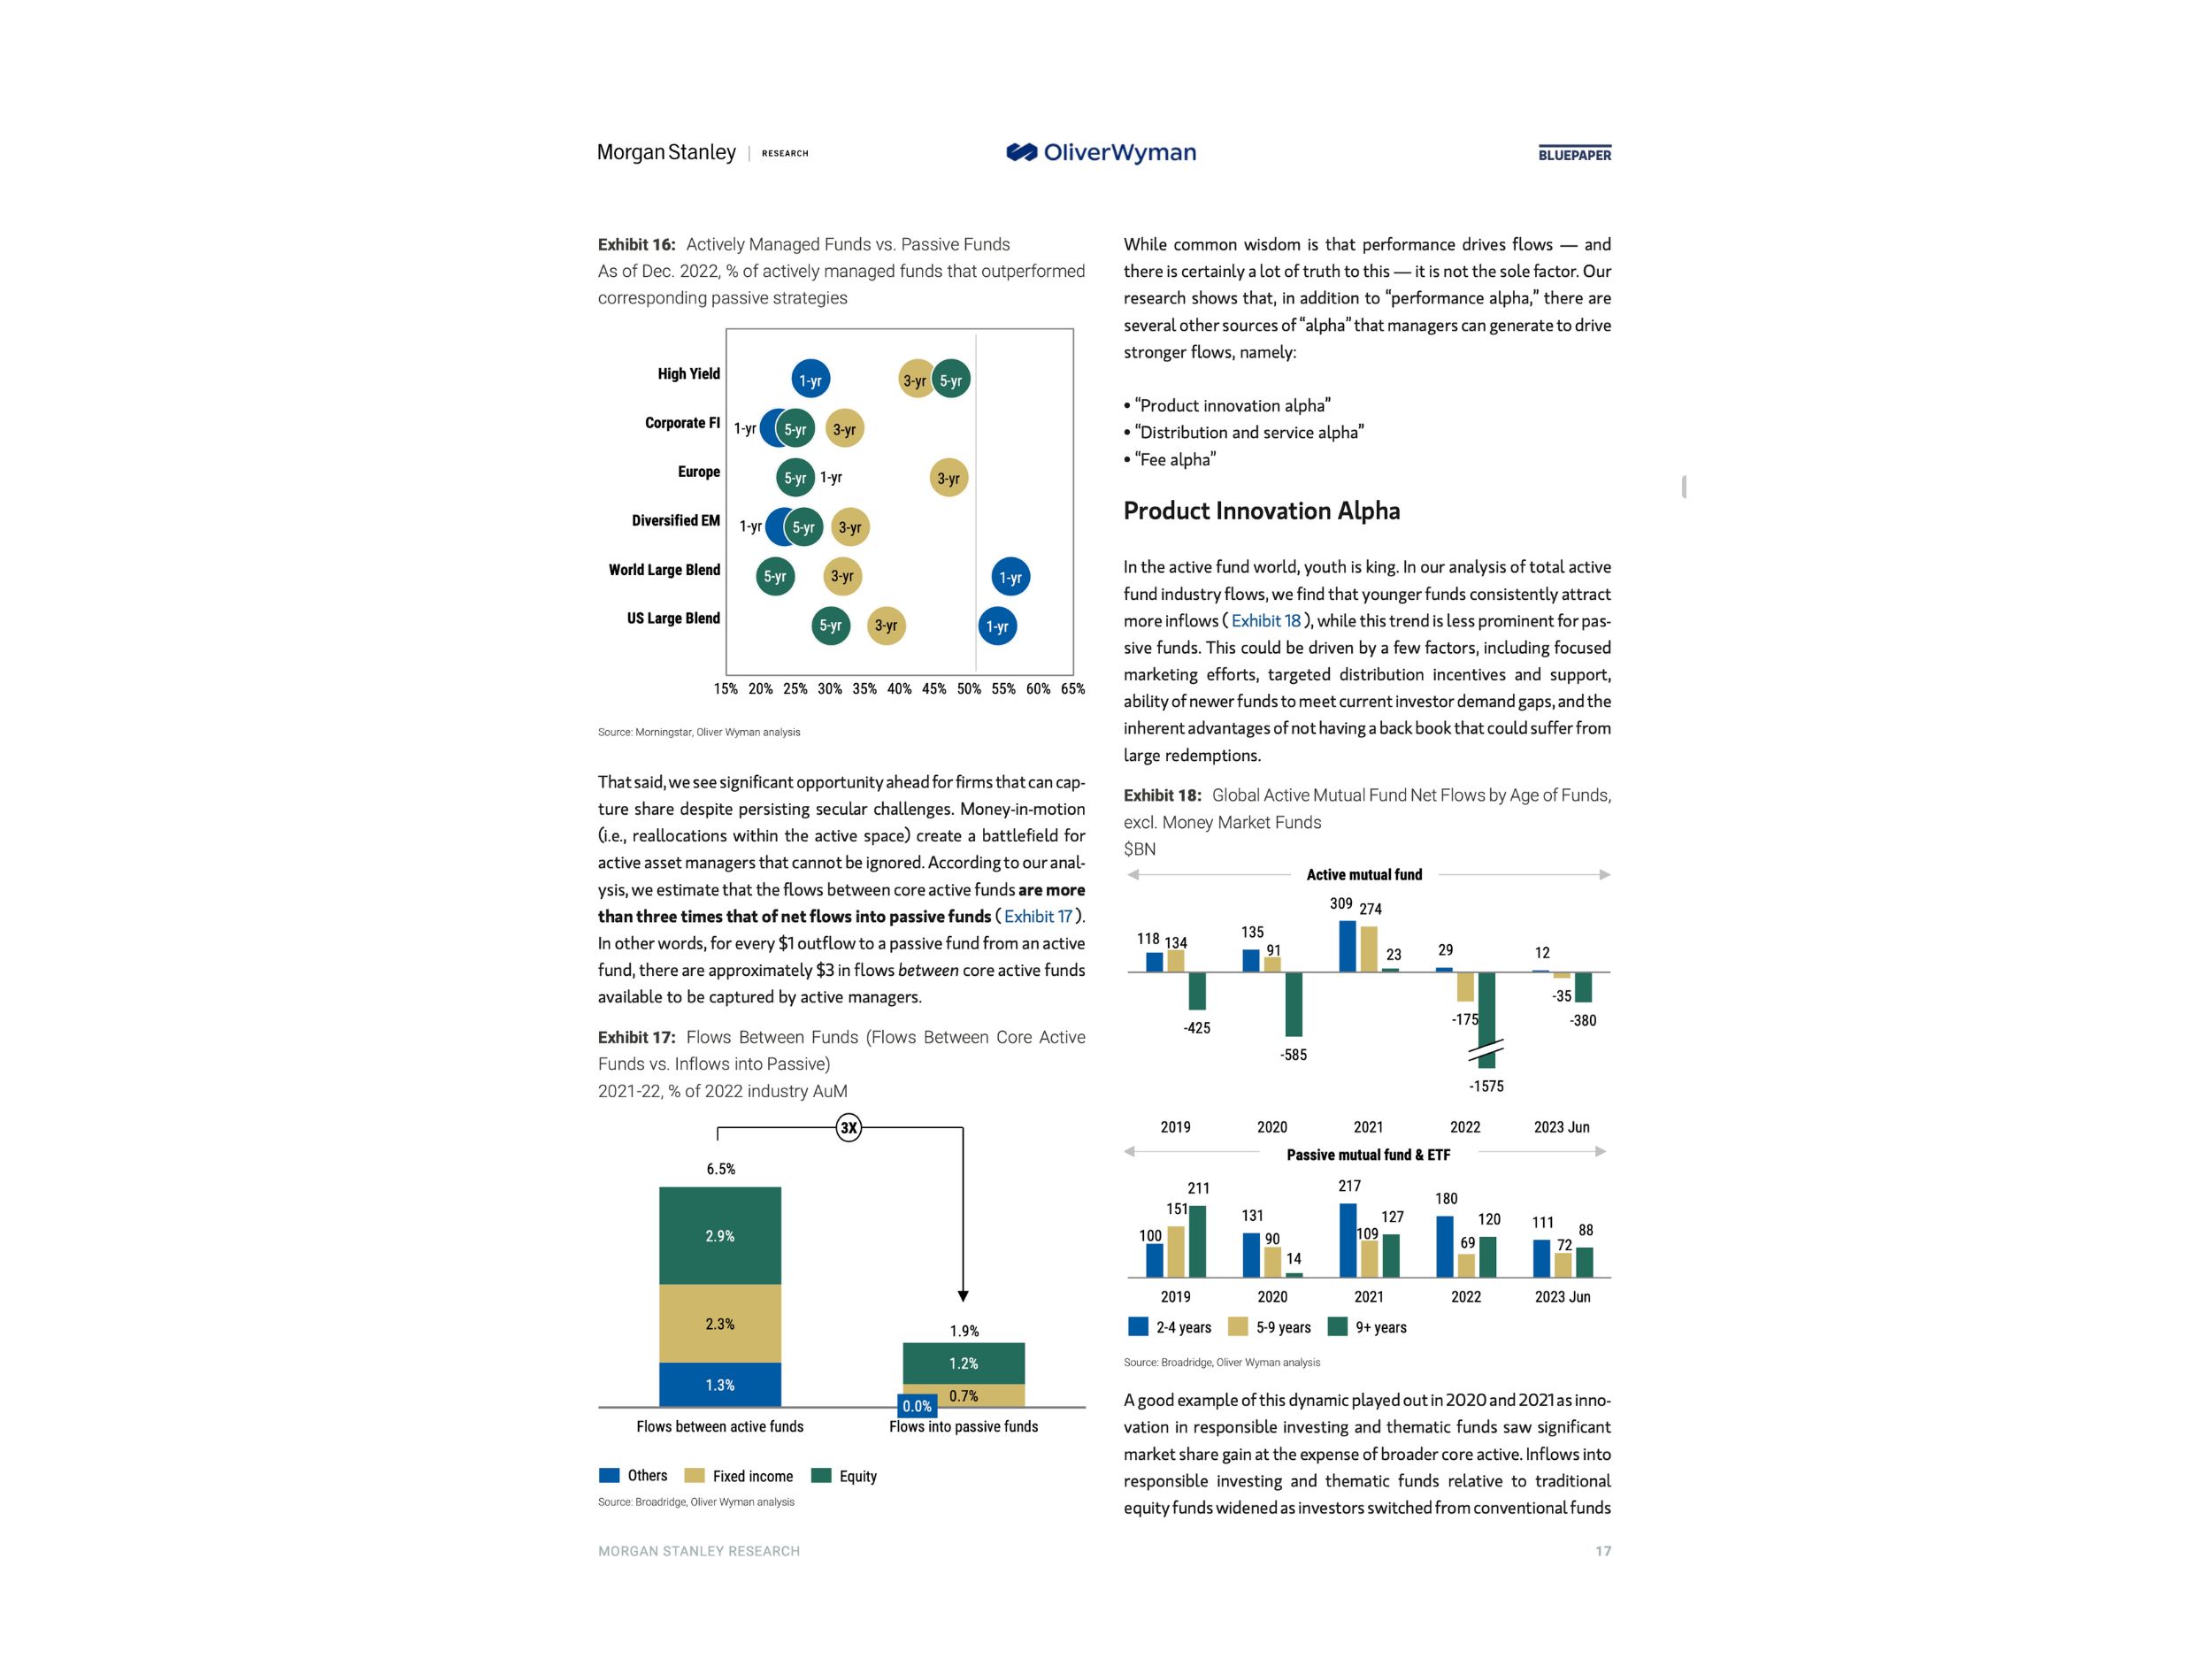
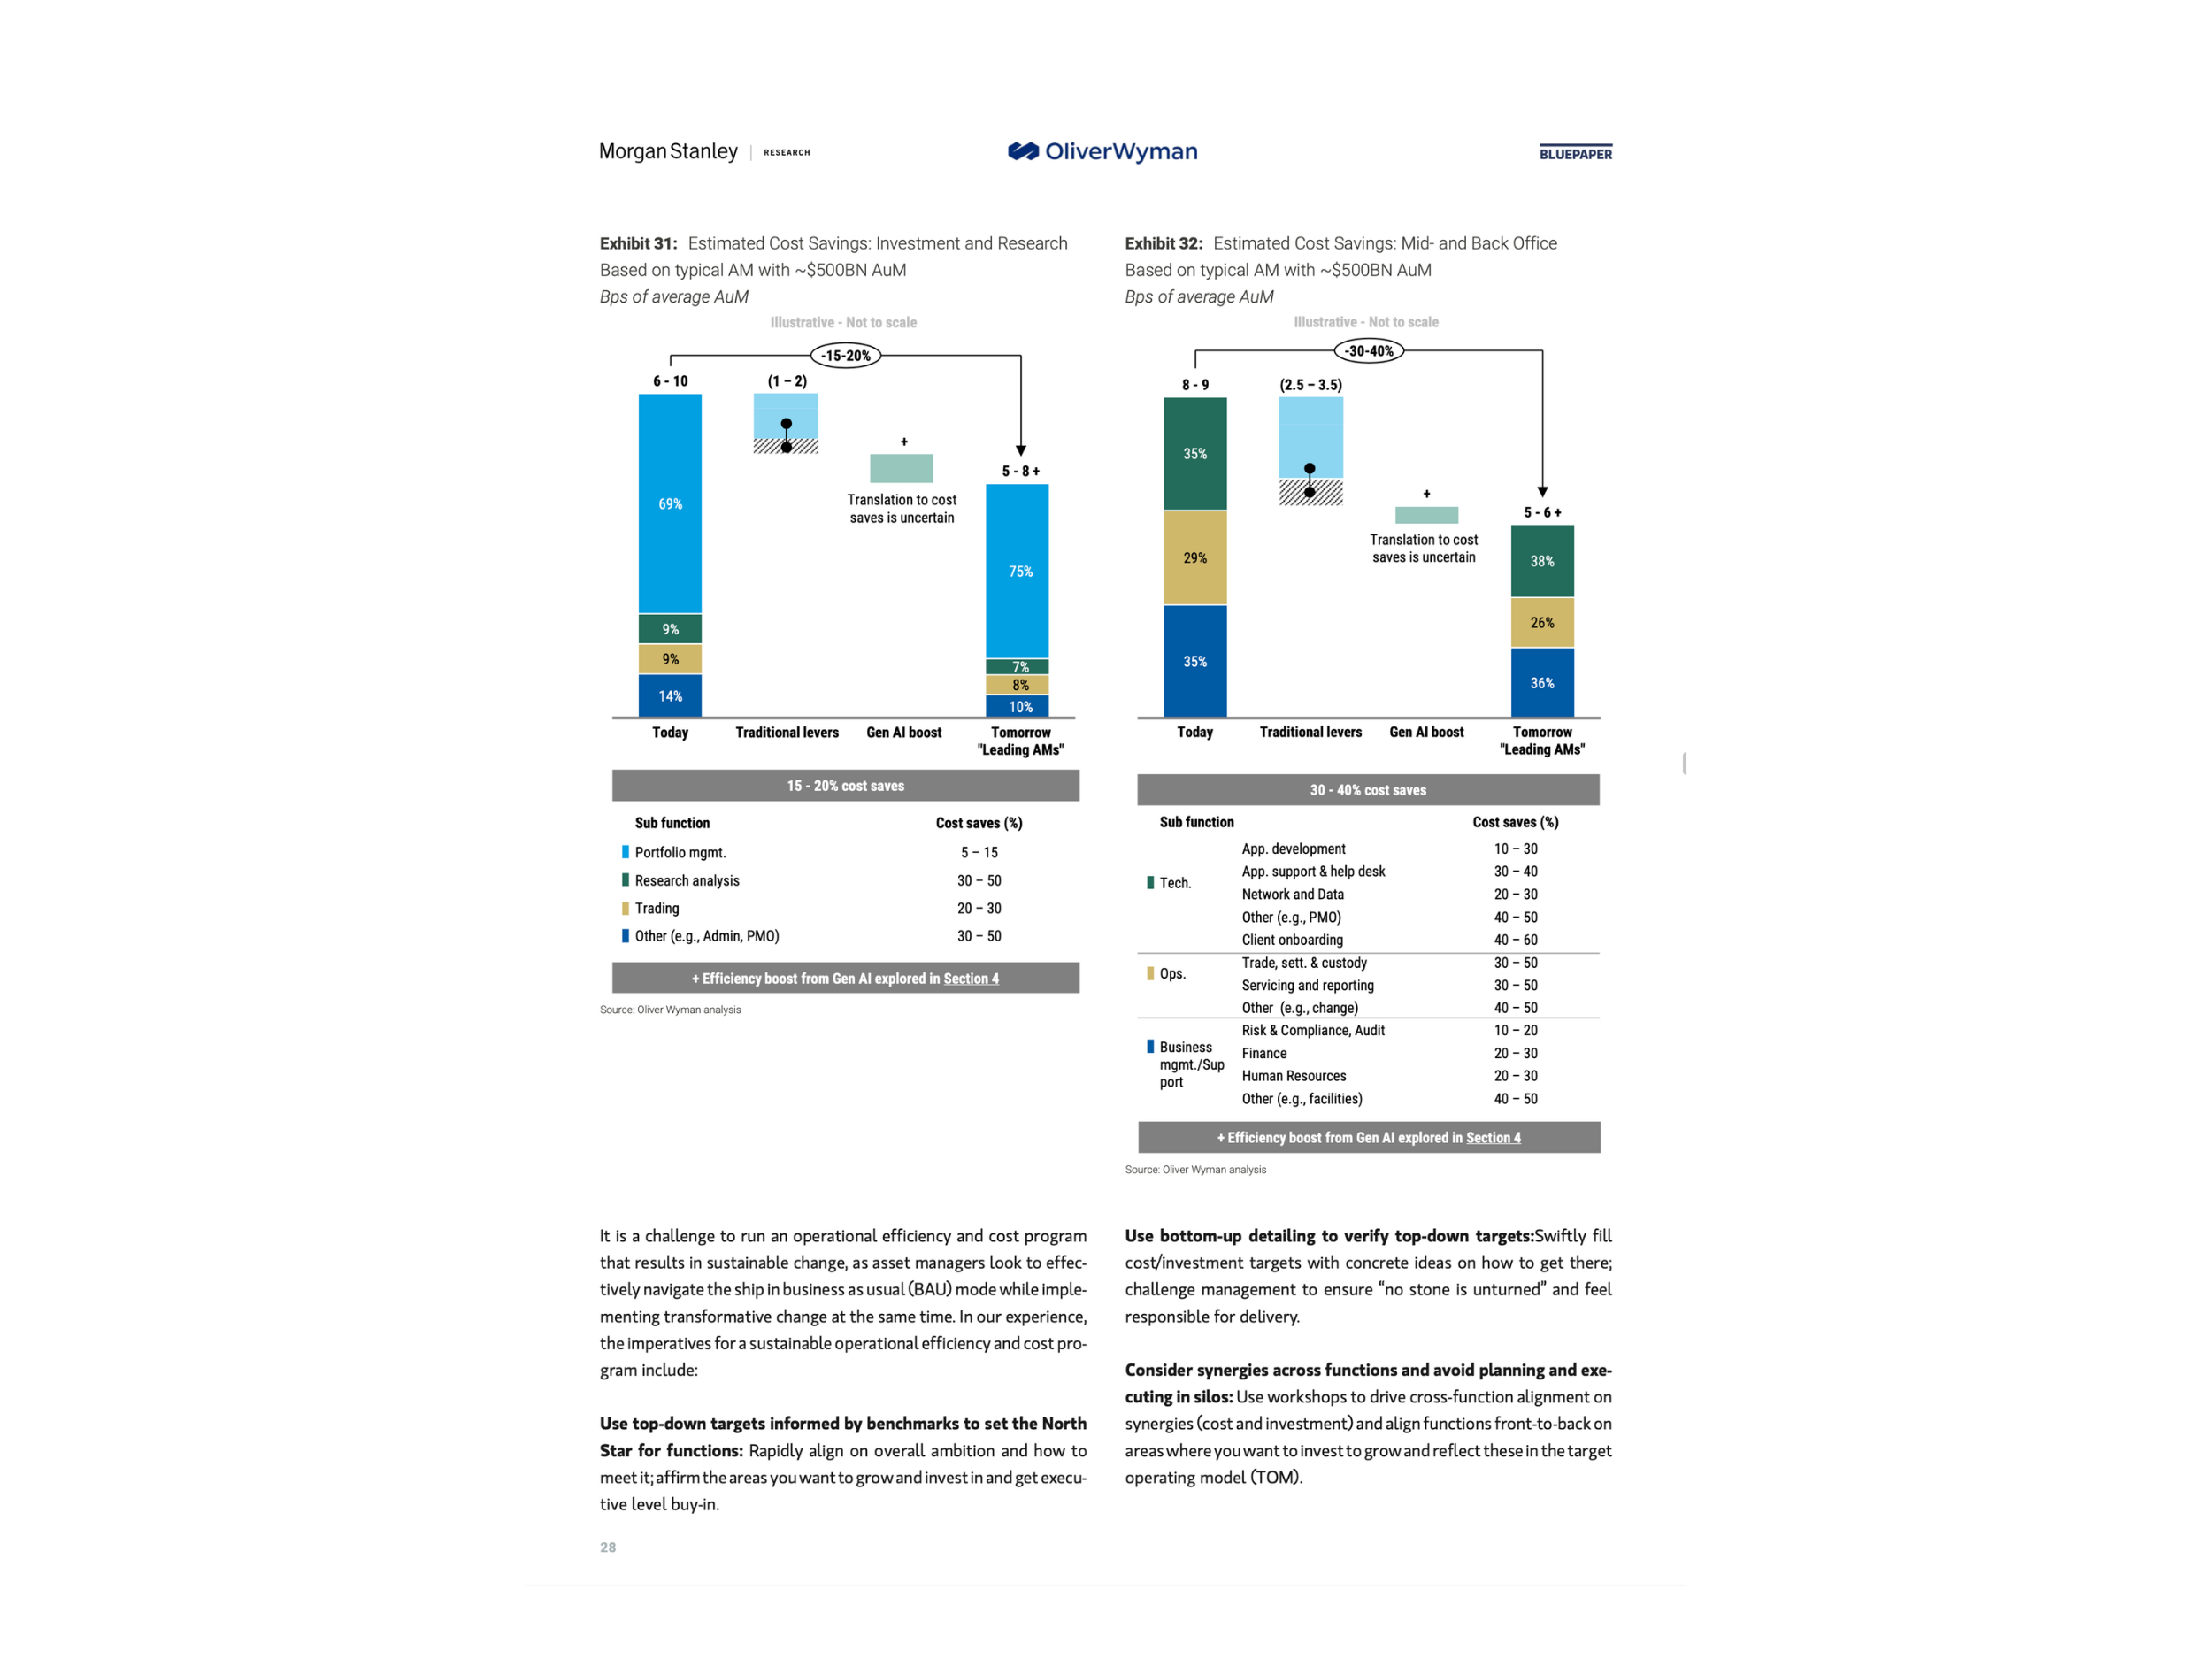
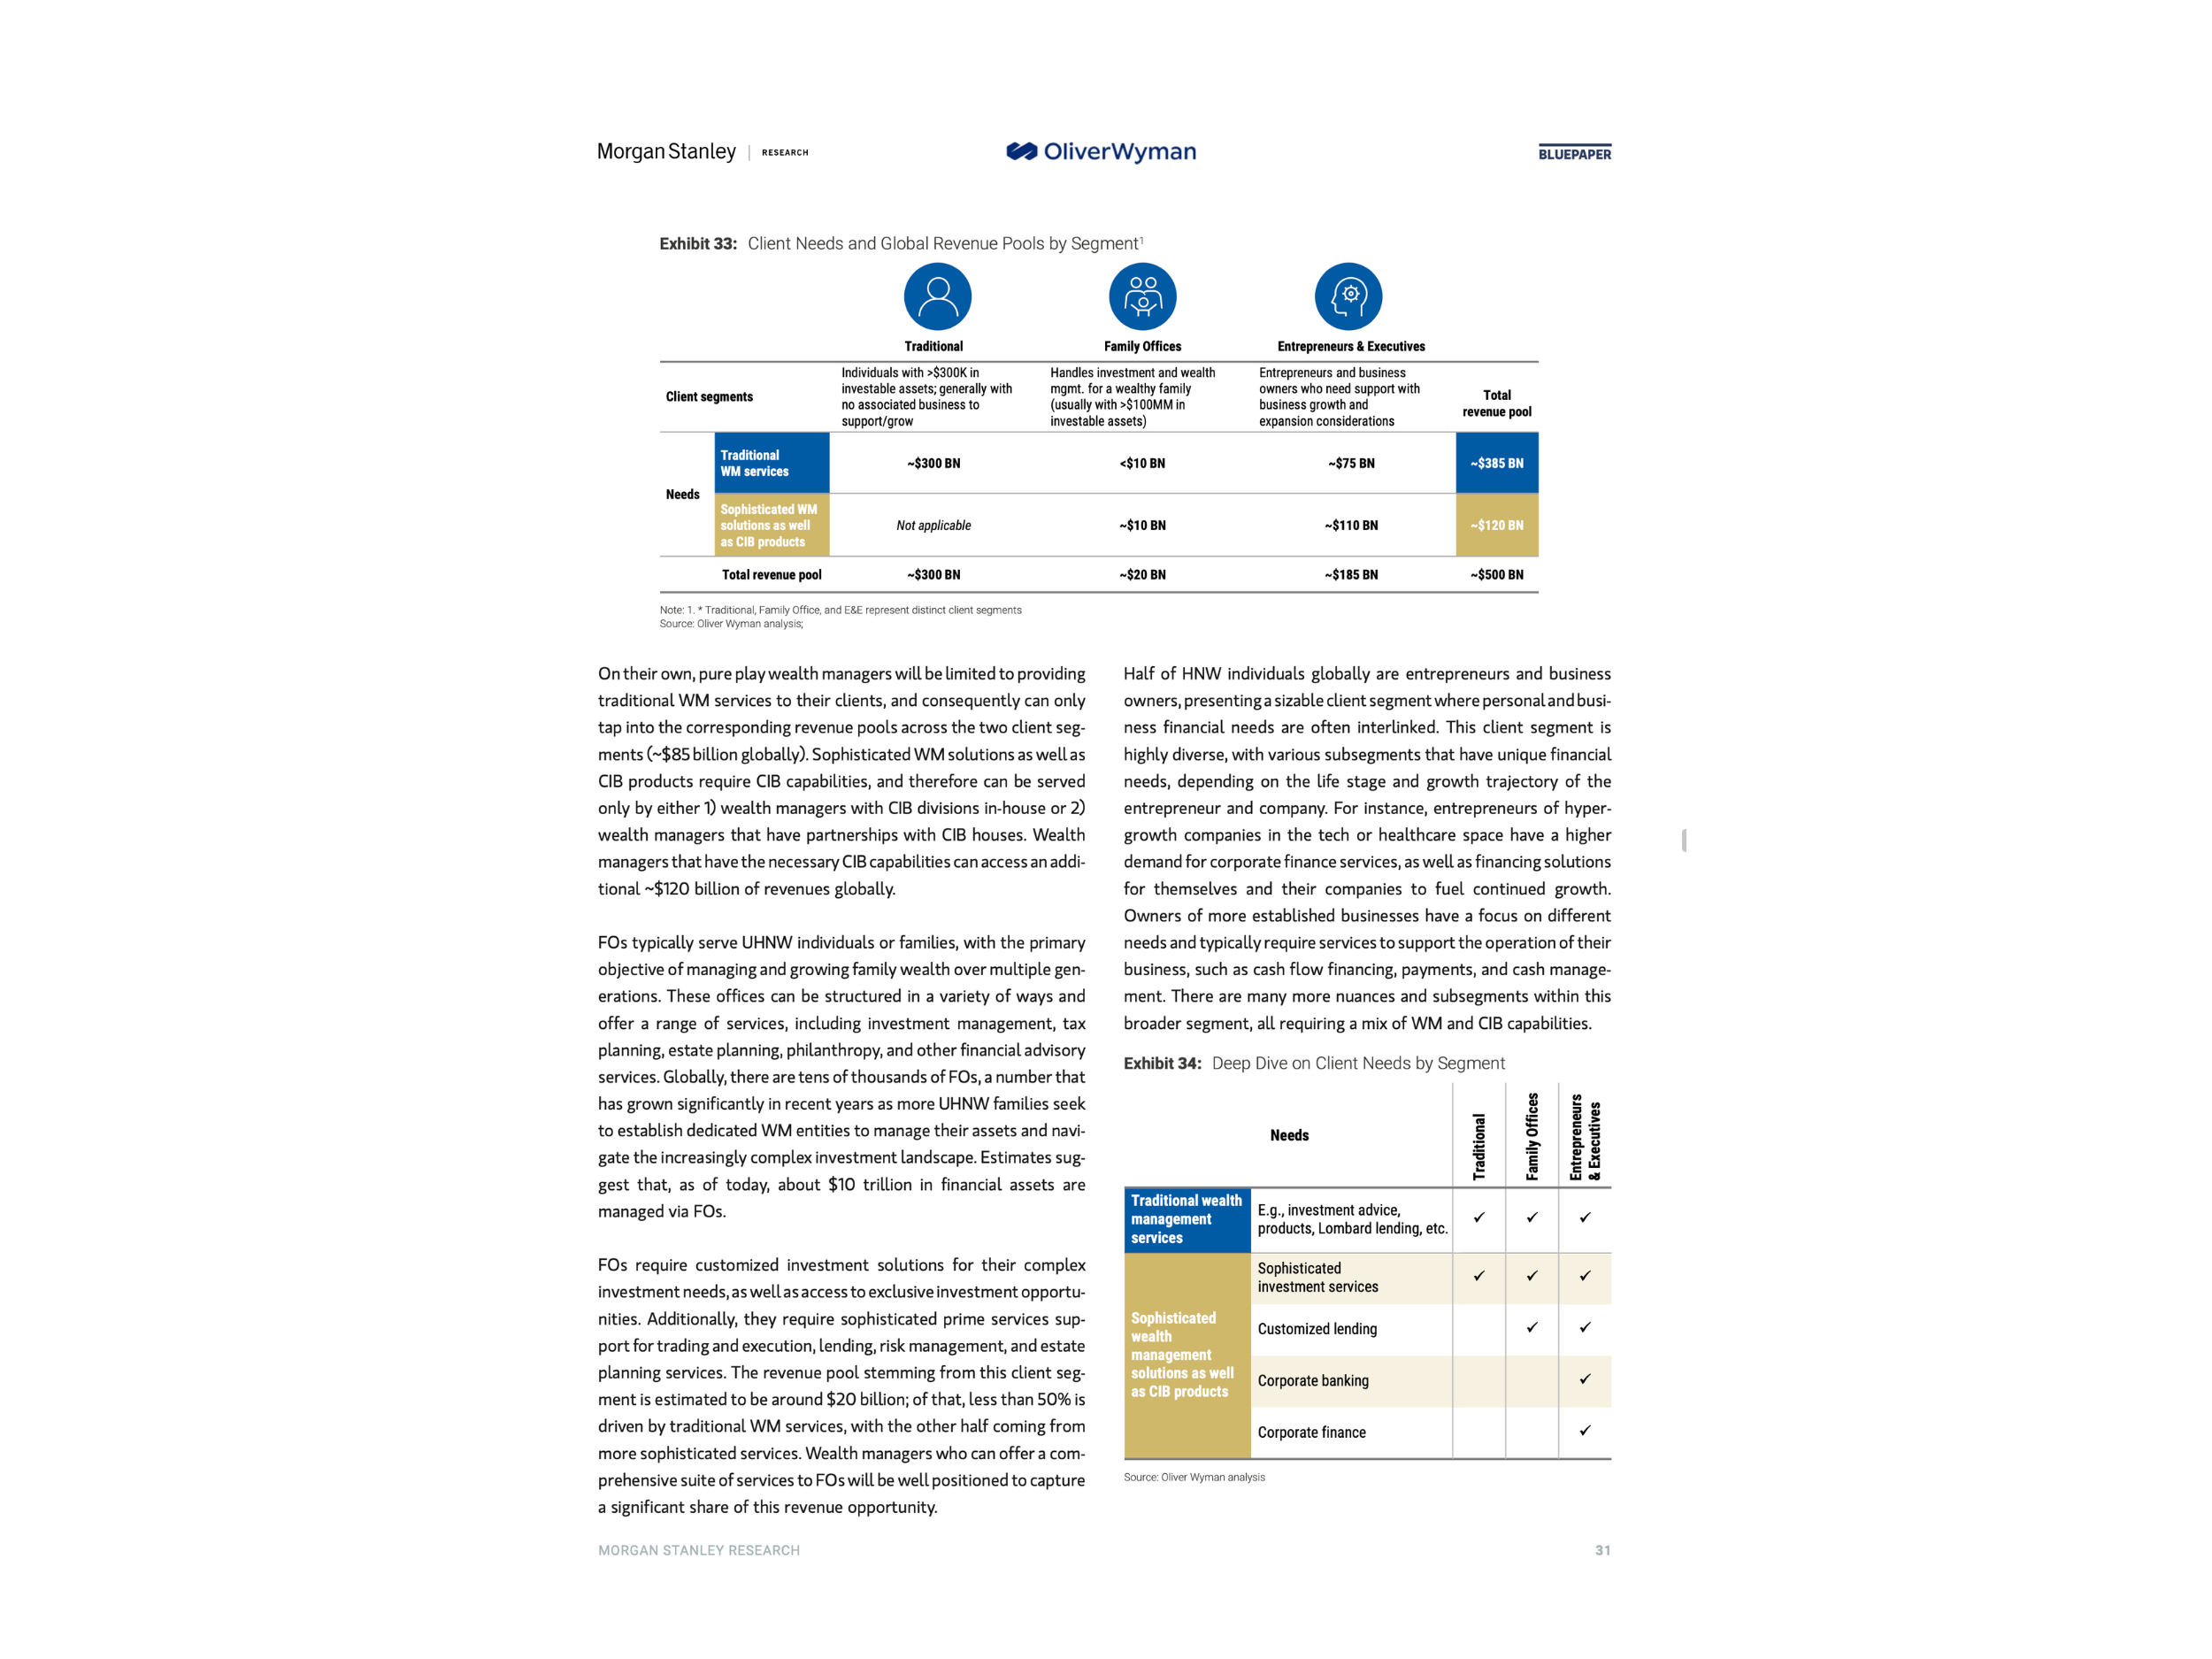
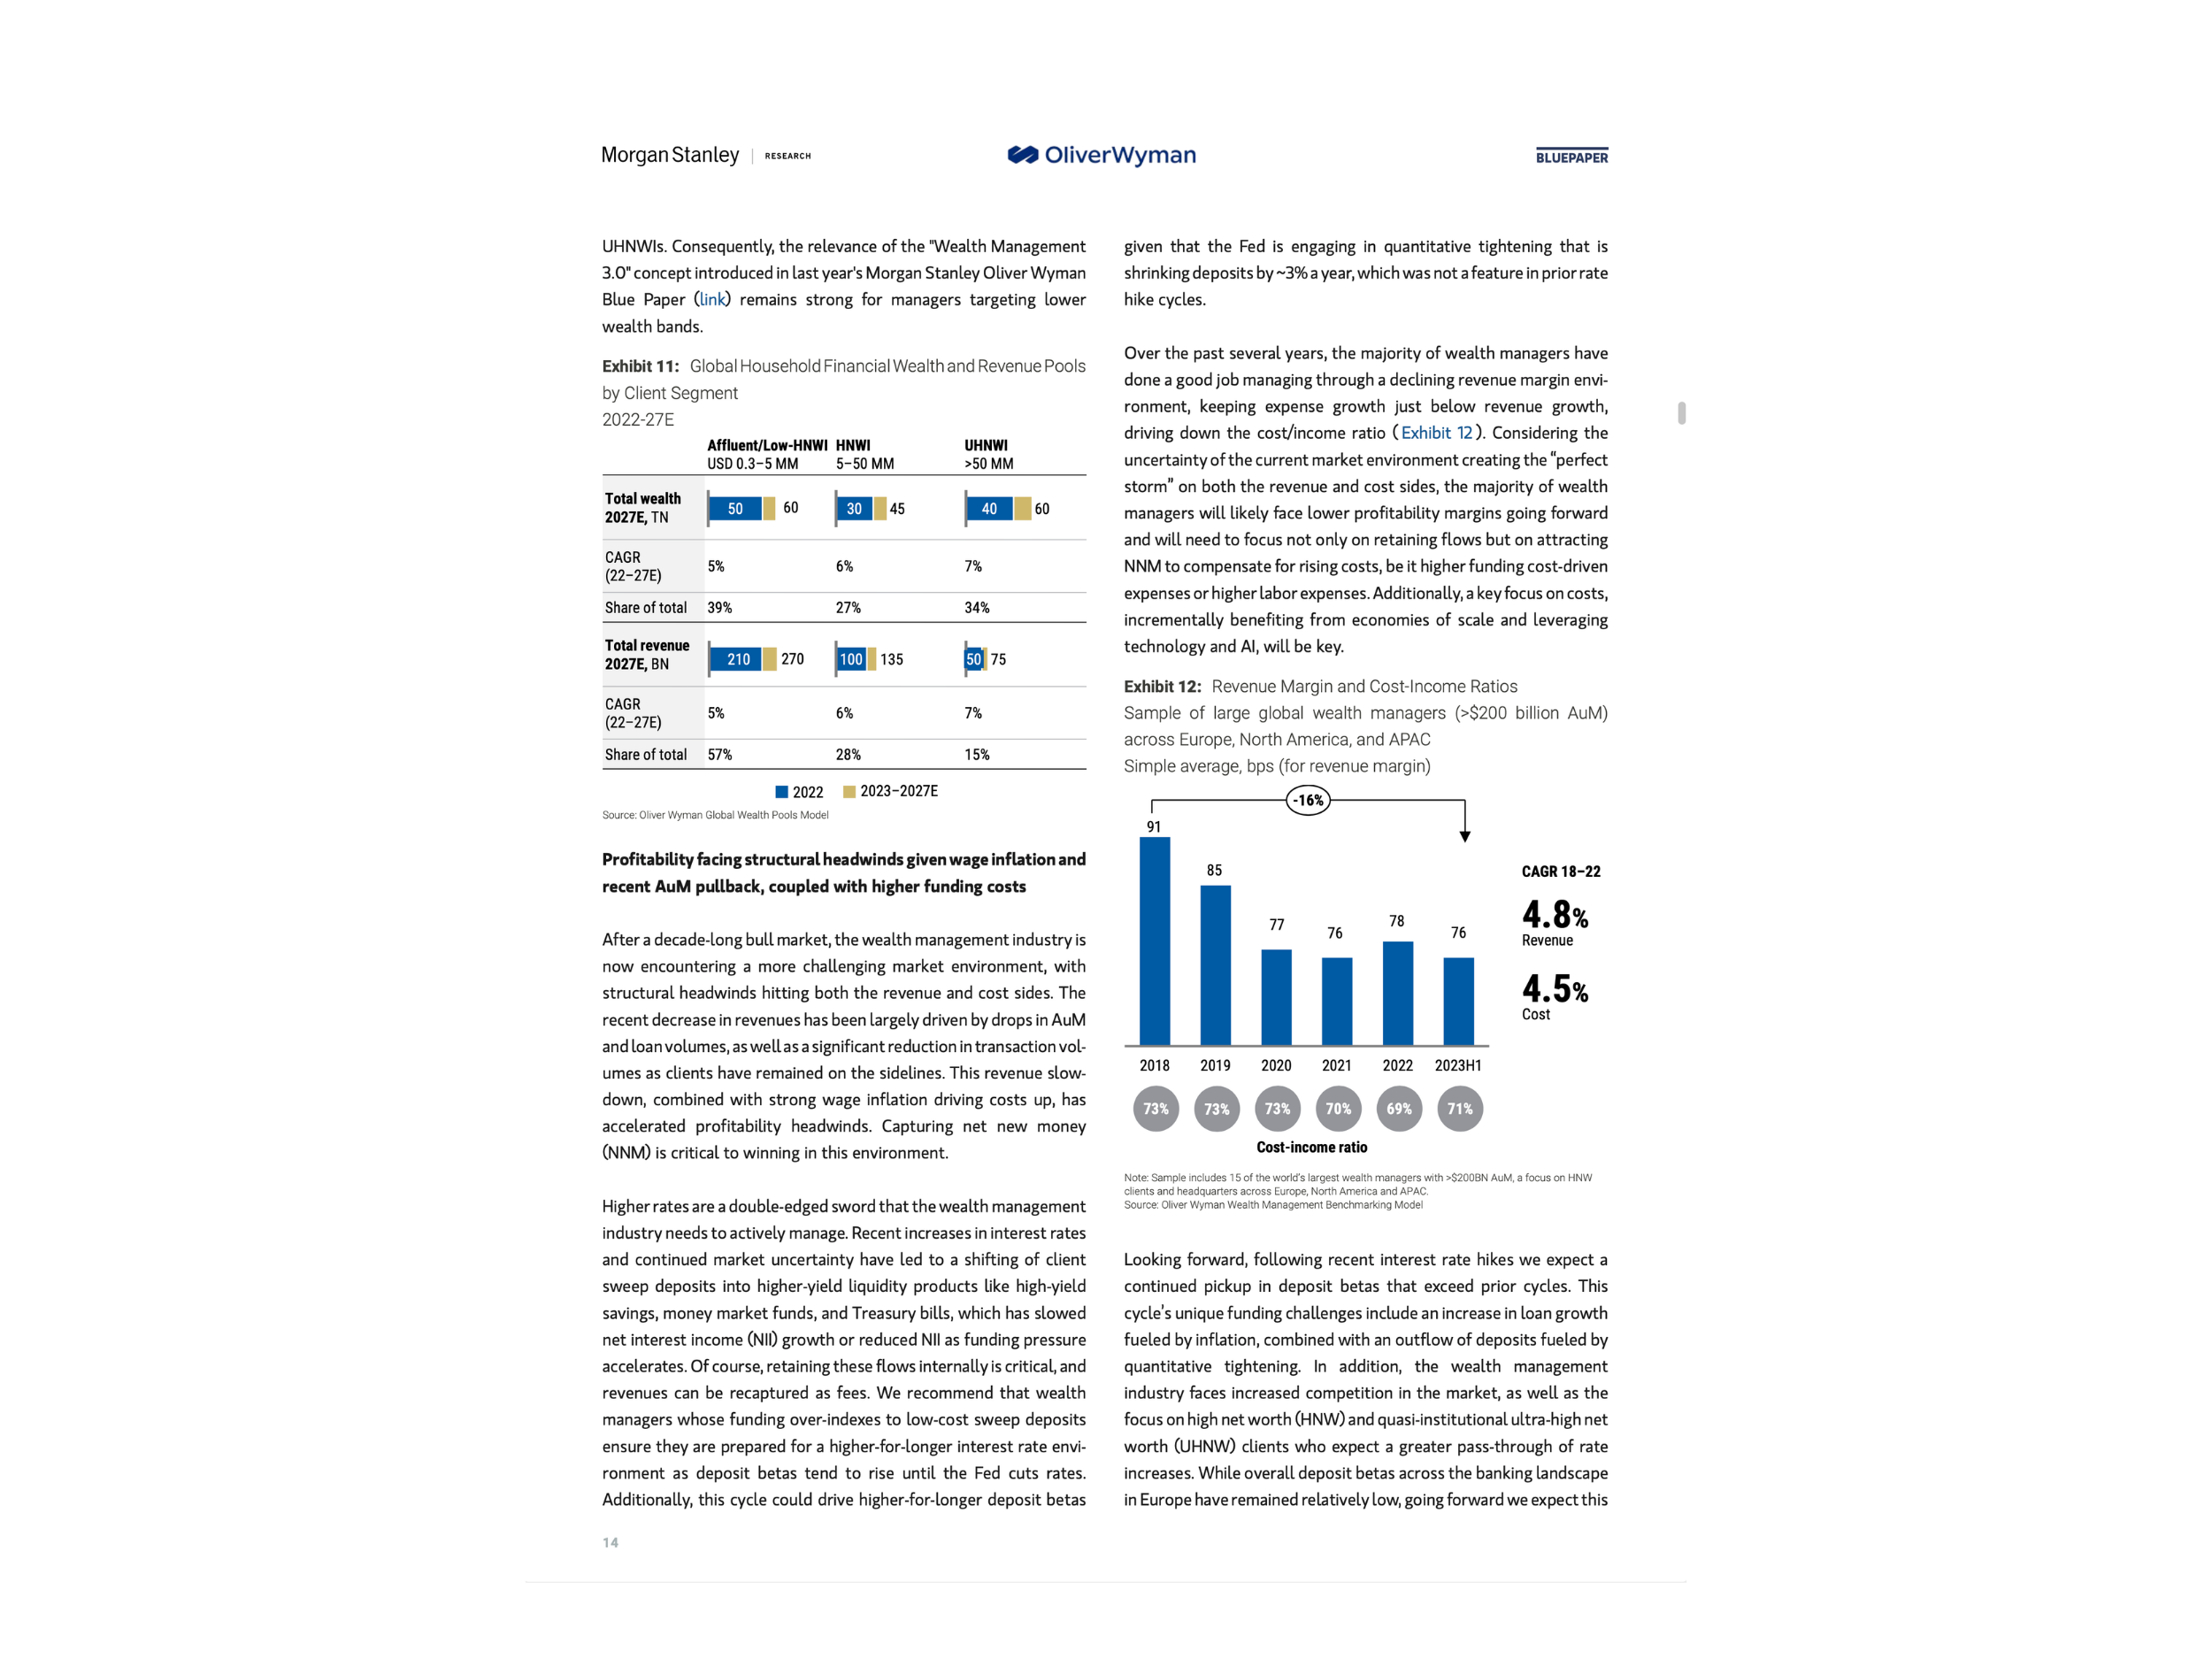
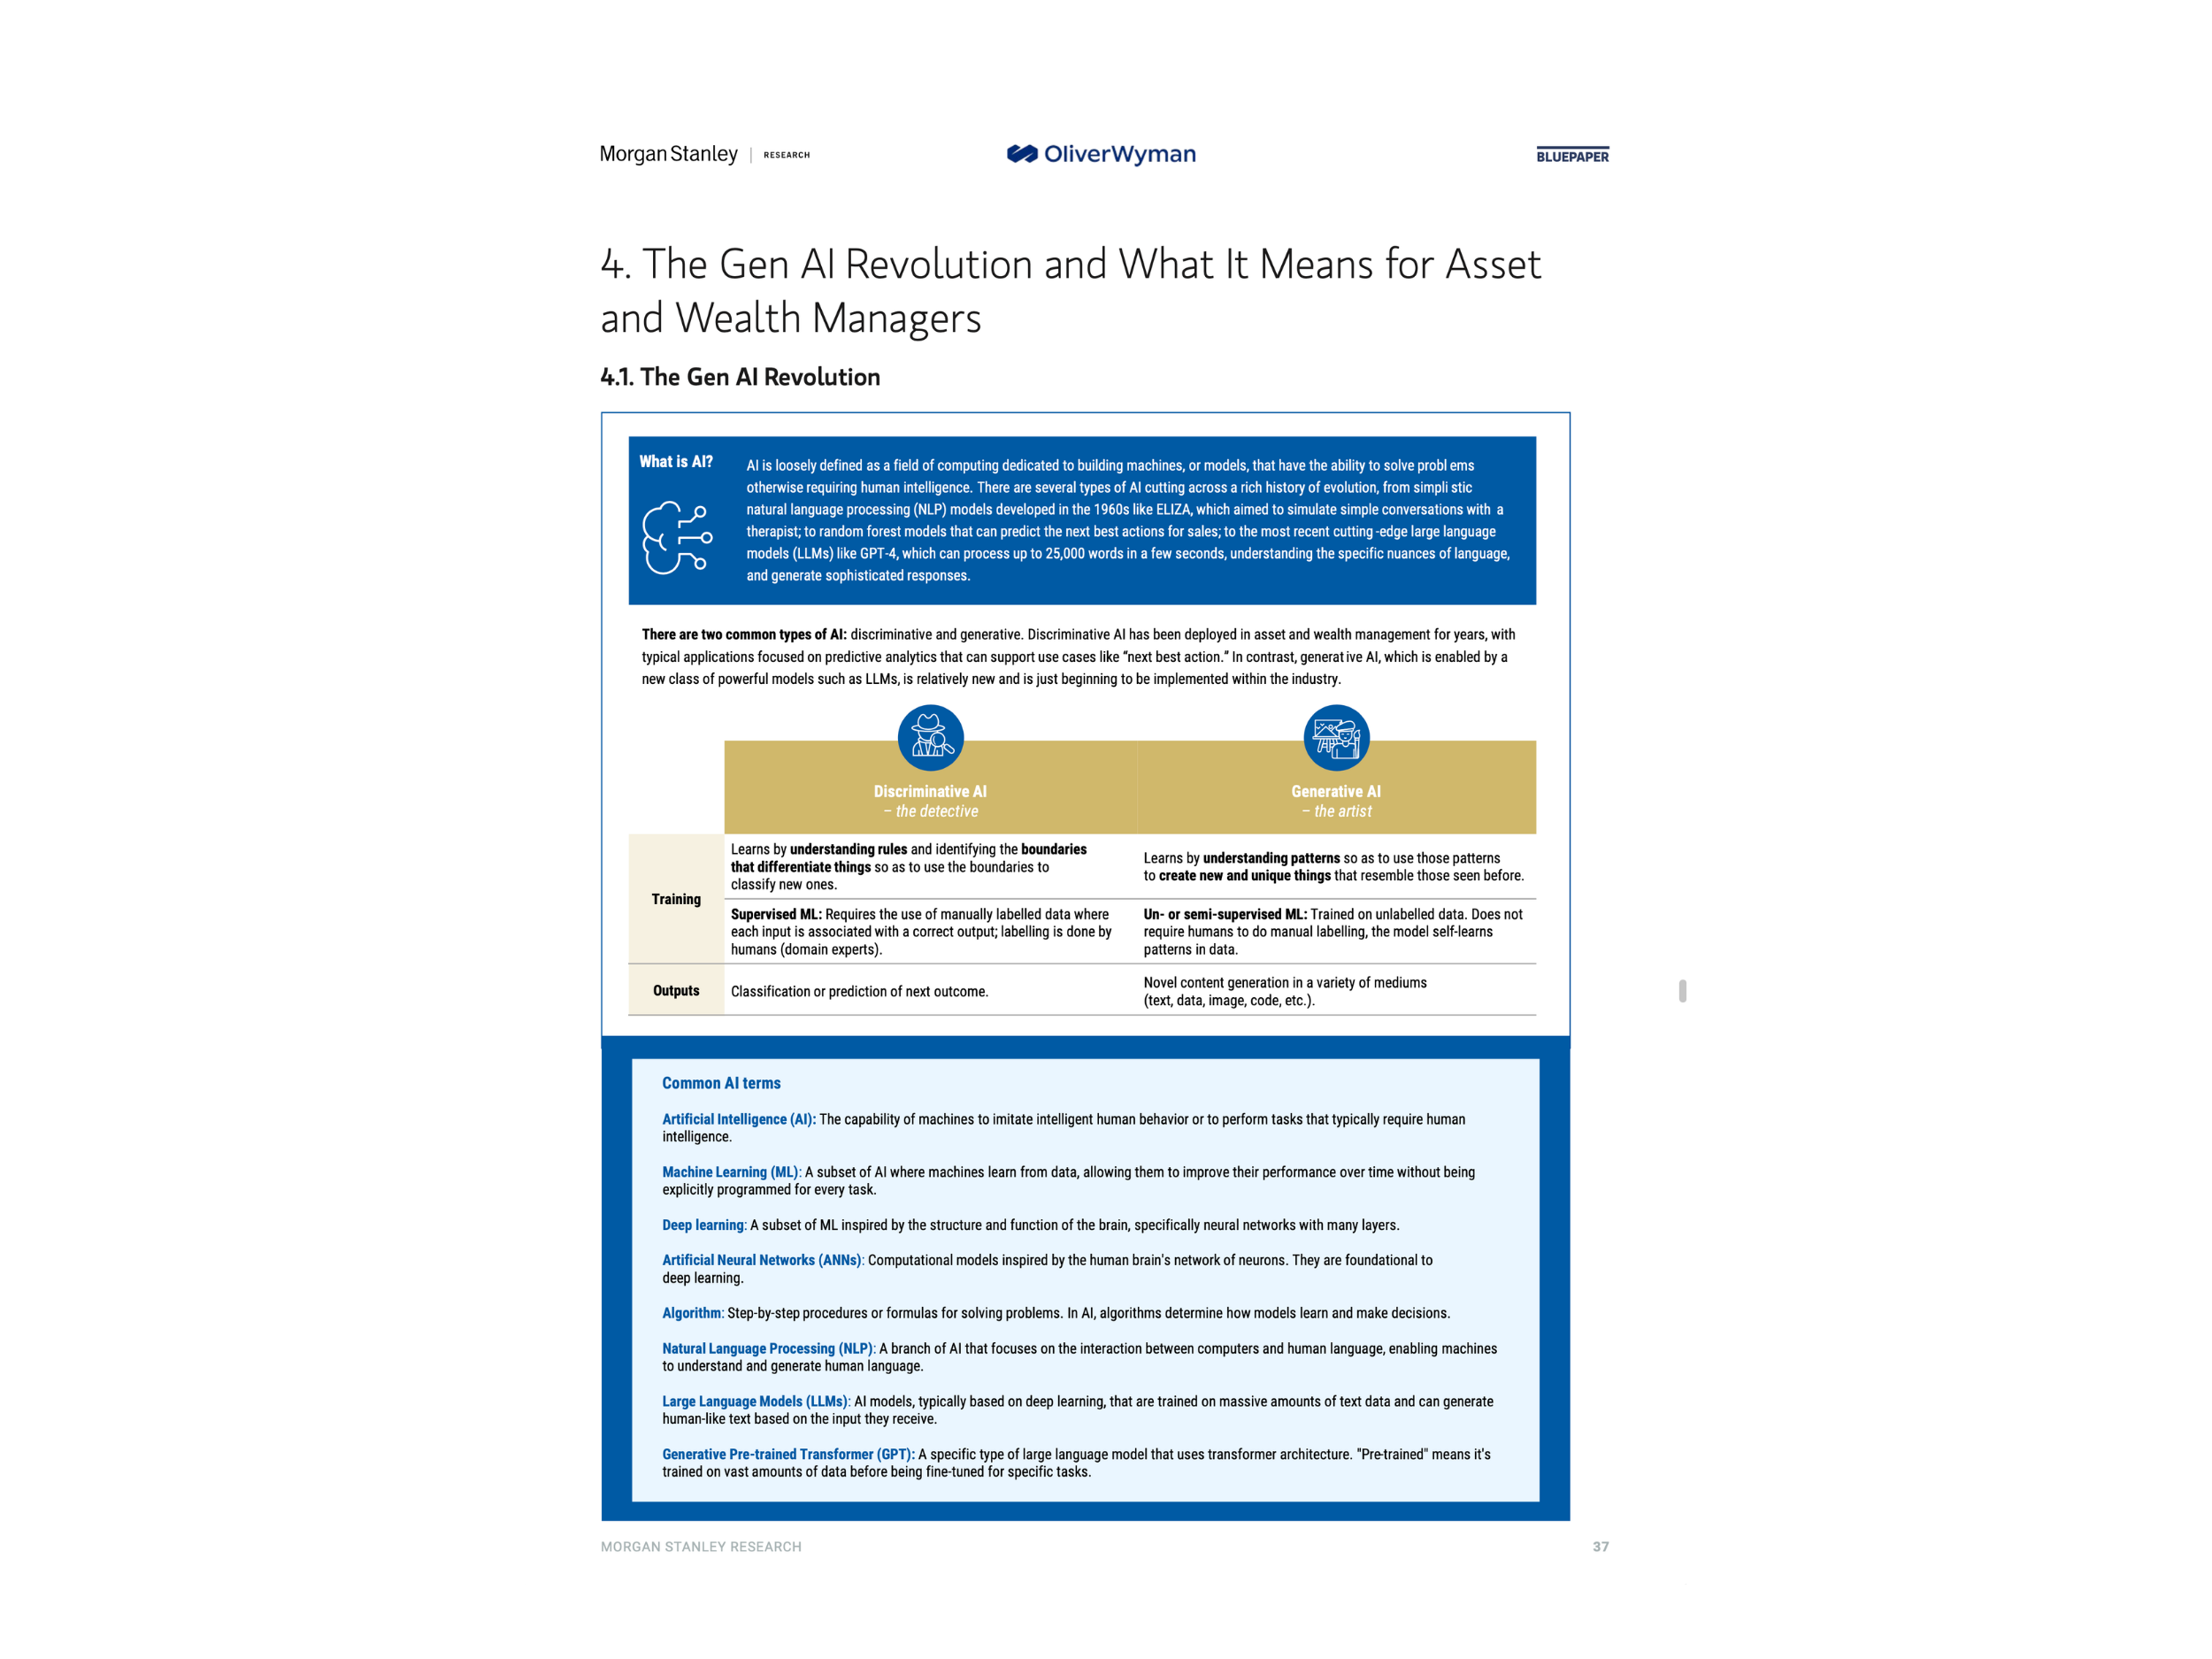
Morgan Stanley needed a definitive industry report produced via Oliver Wyman: 51 complex exhibits, rigid brand requirements, raw Excel inputs, and a publication deadline measured in days. Every chart required interpretation before production.
Approach
A chart grammar before production
Anneli treated charts as reusable components rather than isolated illustrations. She established axes, labels, color logic, and review rules in think-cell before production, then used rolling review to prevent errors from compounding.
Verified results
Published results
- Doubled production throughput from 10 to 20 high-fidelity slides per hour
- Zero data-transfer errors across all 51 exhibits
- 25,000+ downloads after publication
- Coverage by Bloomberg and CNBC