Context and problem
Why guidelines were not enough
Decentralized teams were producing inconsistent reports and presentations, increasing rework and weakening brand authority. Rules alone had not changed behavior.
Case study 02 / 05
200+ consultants. One usable standard. 90% adoption.
Context and problem
Decentralized teams were producing inconsistent reports and presentations, increasing rework and weakening brand authority. Rules alone had not changed behavior.
Approach
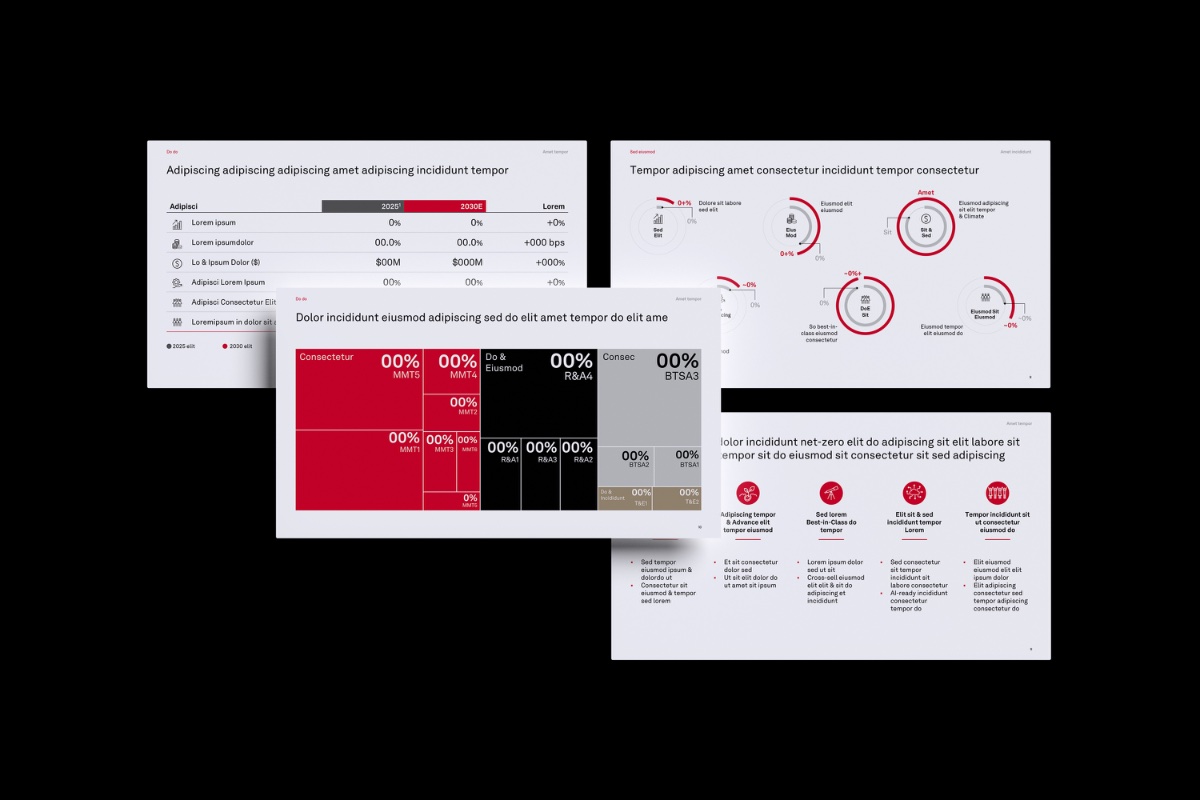
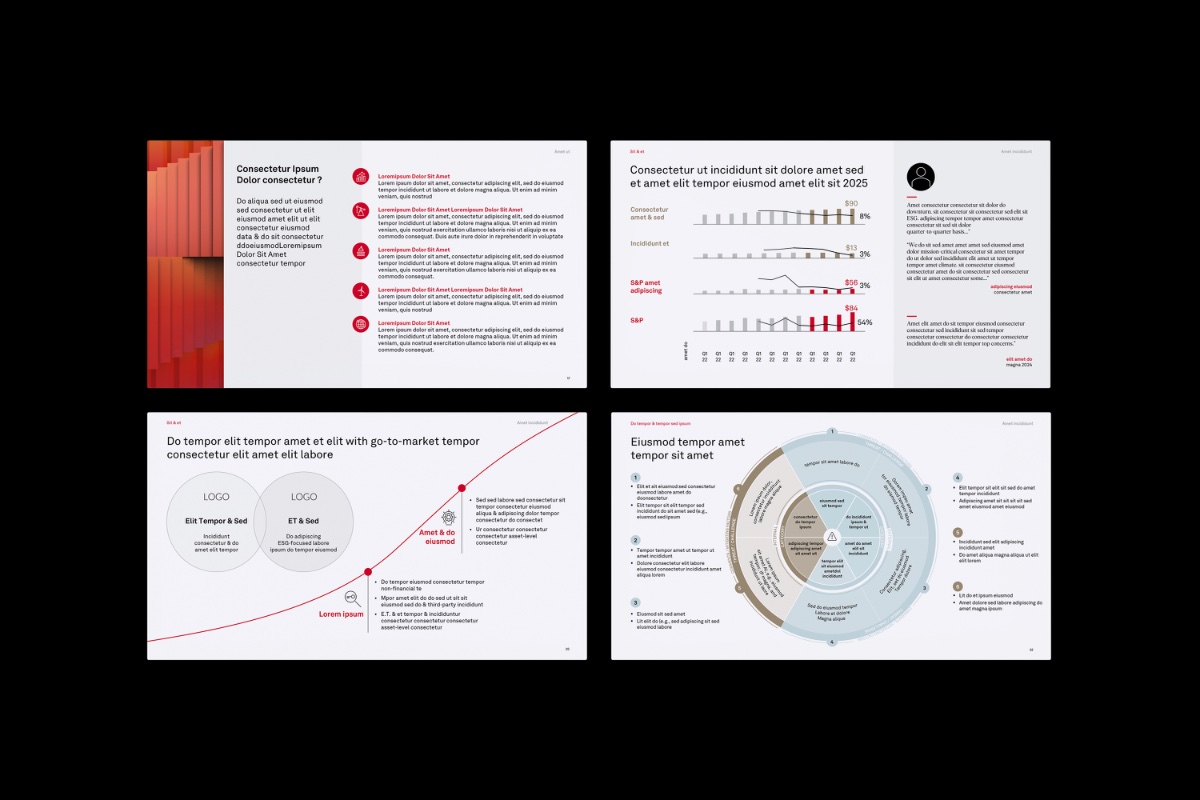
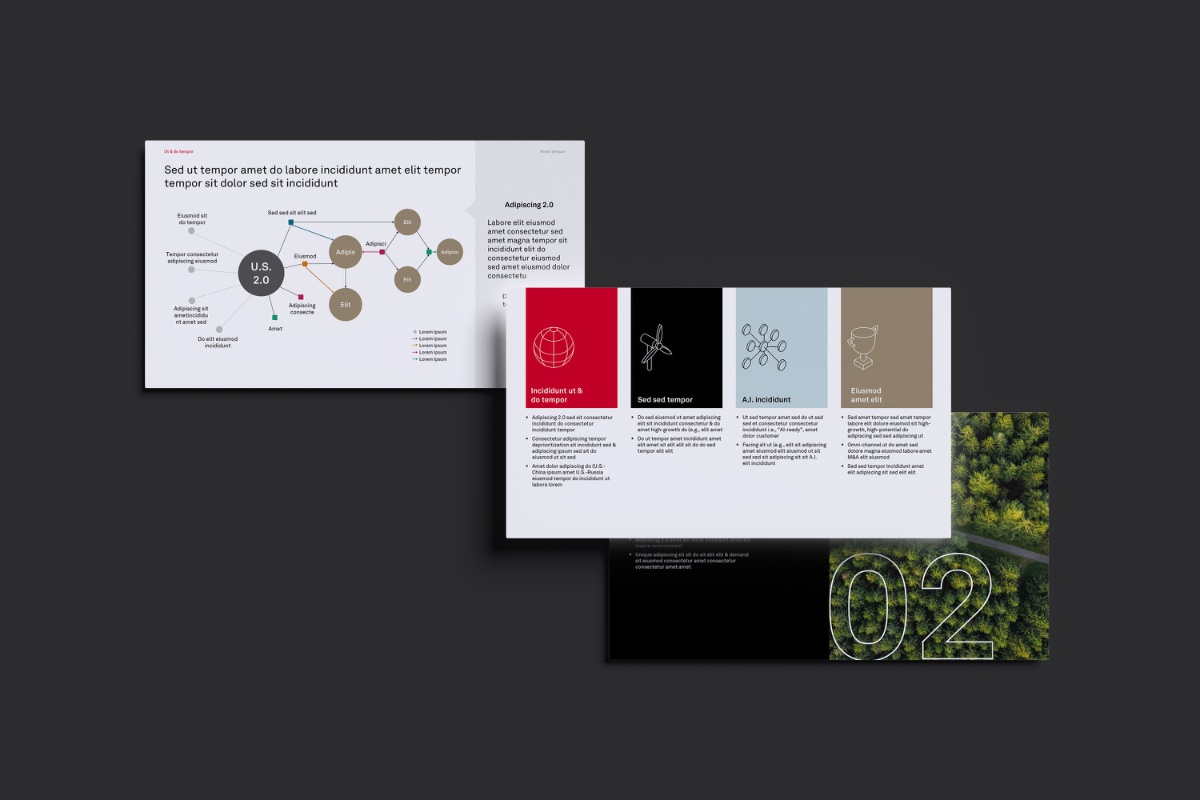
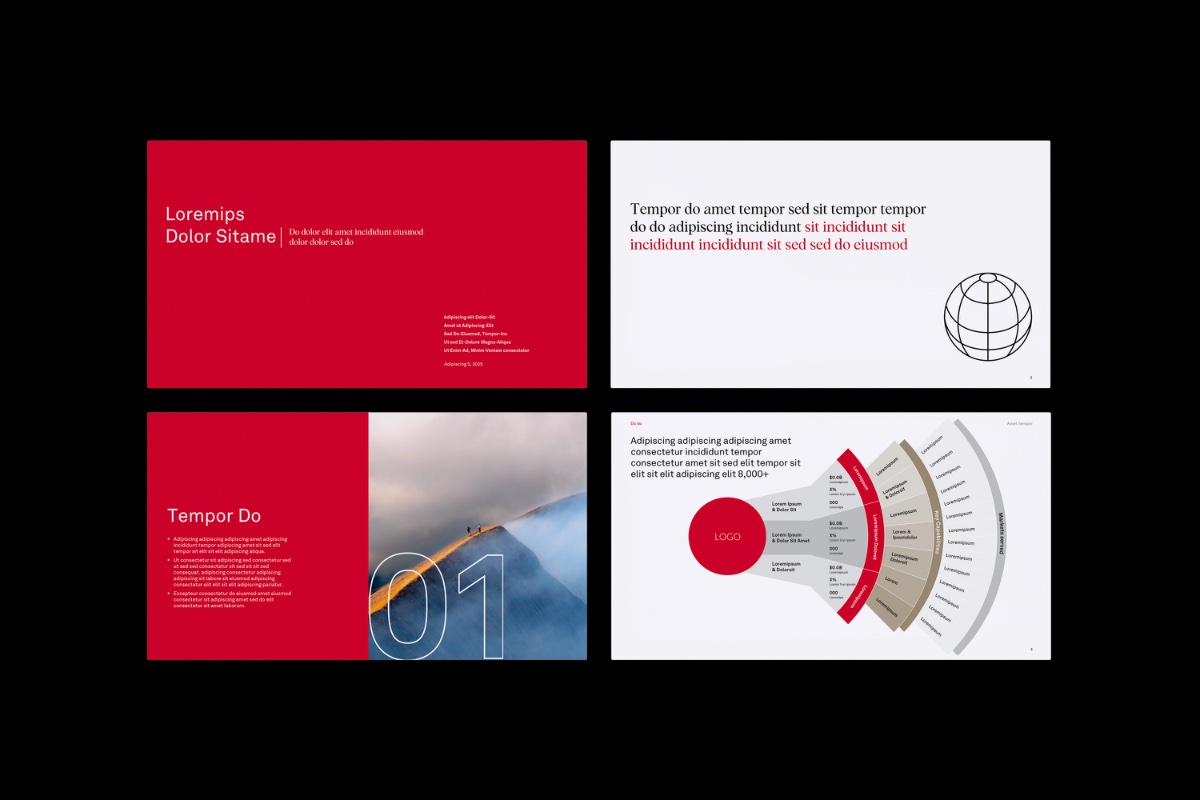
Anneli shifted governance from policing to enablement. She created practical templates, chart systems, editorial layouts, and guidance that explained why each decision improved communication, then trained more than 200 users.
Verified results
Selected views
Continue exploring